Demonstration · Illustrative data · BI Consulting Services
FIFA26 Inc. × BI Consulting Services
Post-Event FP&A Close-Out — Budget vs Actuals, 11 US Host Cities
Final 19 July 2026 is behind us. This board closes the books by workstream, host city and phase, flags risk and opportunity variance, states the project P&L, and drills every variance to the line item that caused it.
Prepared for Sonia
FIFA26 Inc. · Miami October 2026 · Demonstration build
Host-city variance map — 11 US venues, marker sized by budget-vs-actual gap
Click a city to filter every panel to that venue. Click again to clear.
Over budgetUnder budgetWithin ±1%
Marker area ∝ |variance $|
What this board answers
Three questions the FP&A team asked, answered from the current selection
Cumulative spend — budget vs actual, Aug 2024 → Sep 2026
Revenue allocated pro-rata to workstream budget · costs = actuals
Root-cause drill-down — line items driving the variance
Top 8 by absolute variance in the selection · flags at ±5% of line-item budget
RiskOpportunityOn track
Line item
Workstream
Host city · phase
Budget
Actual
Variance
Flag
Ask the data
Natural-language Q&A over the same semantic model (mock-up of the Copilot experience)
Demonstration · Illustrative data · BI Consulting Services
Also from BI Consulting Services
Private AI on your own server
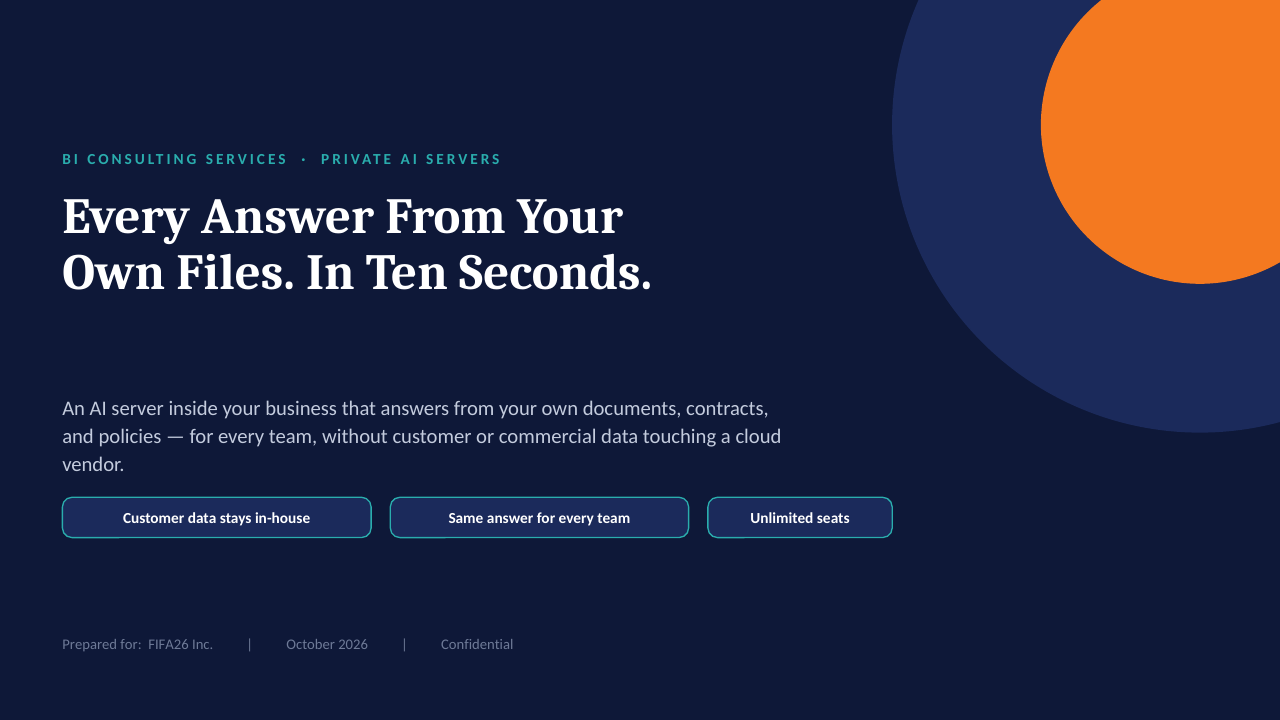
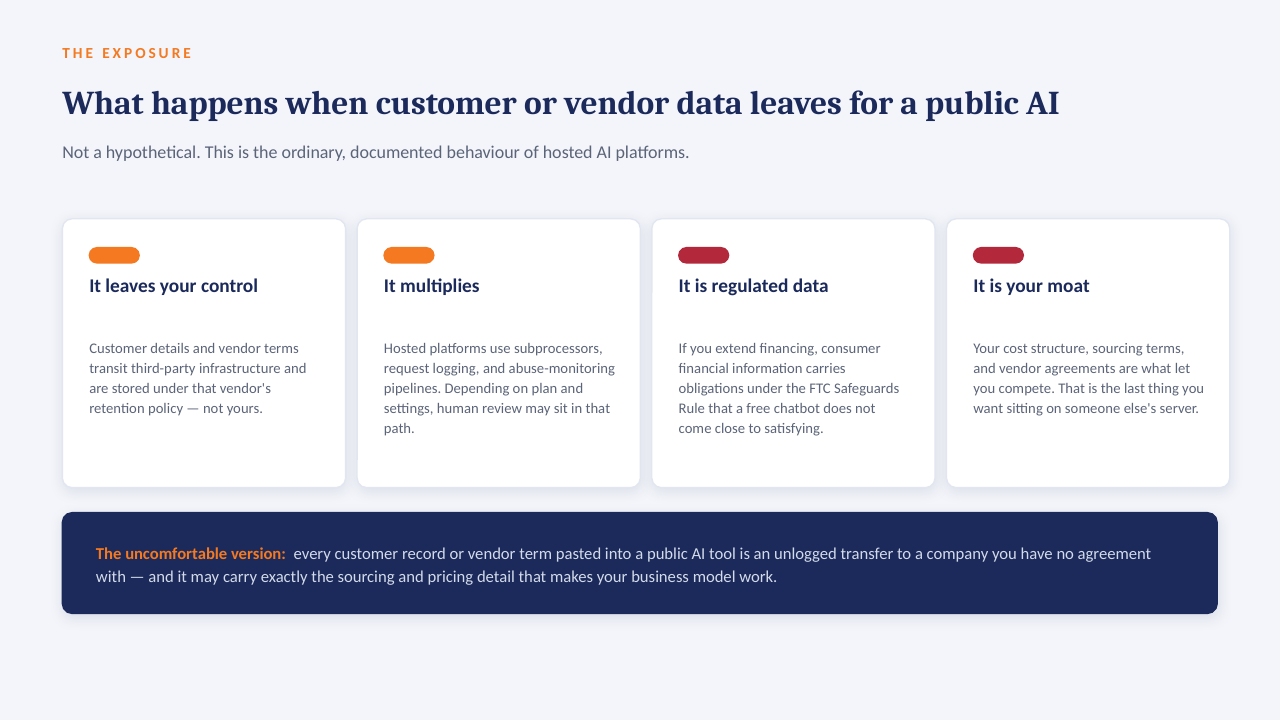
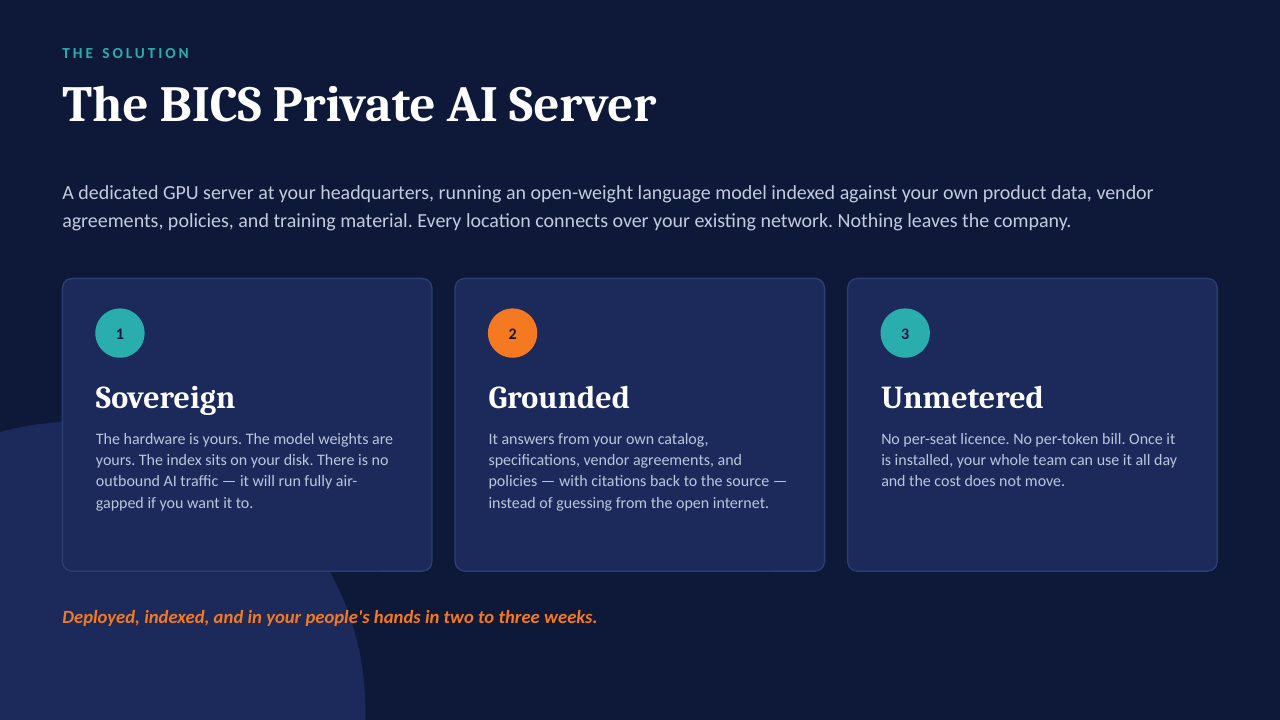
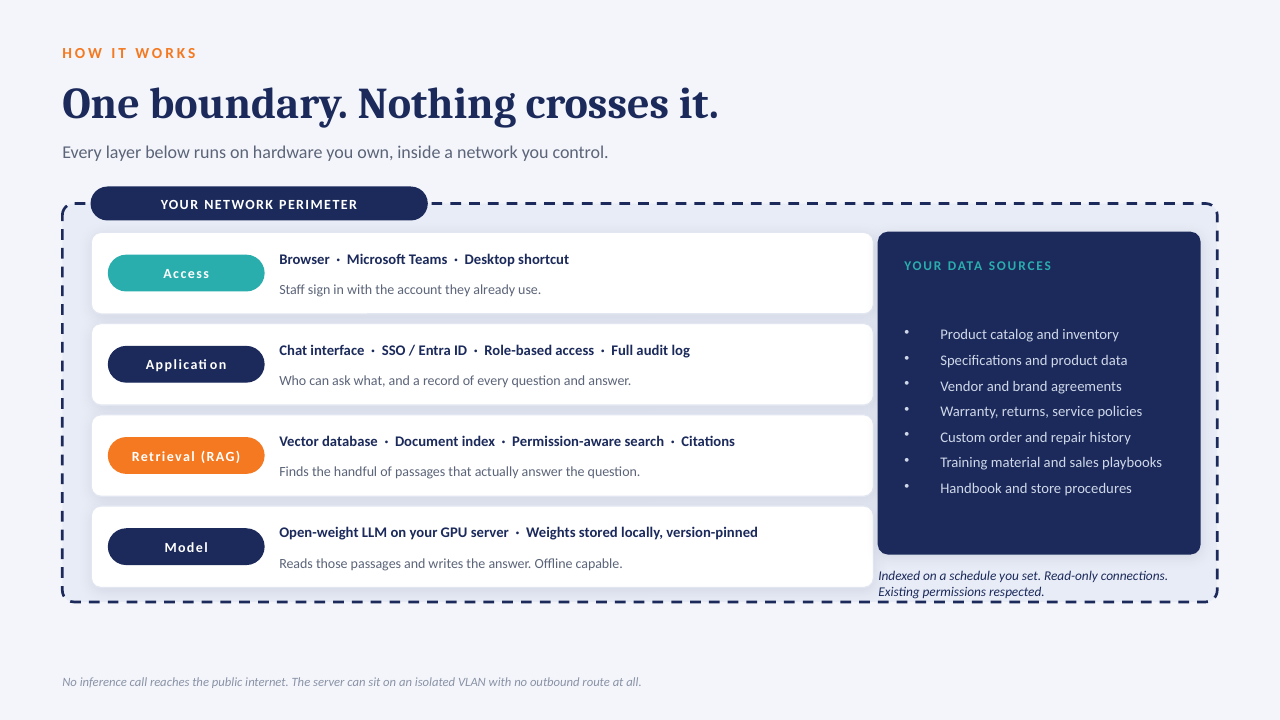
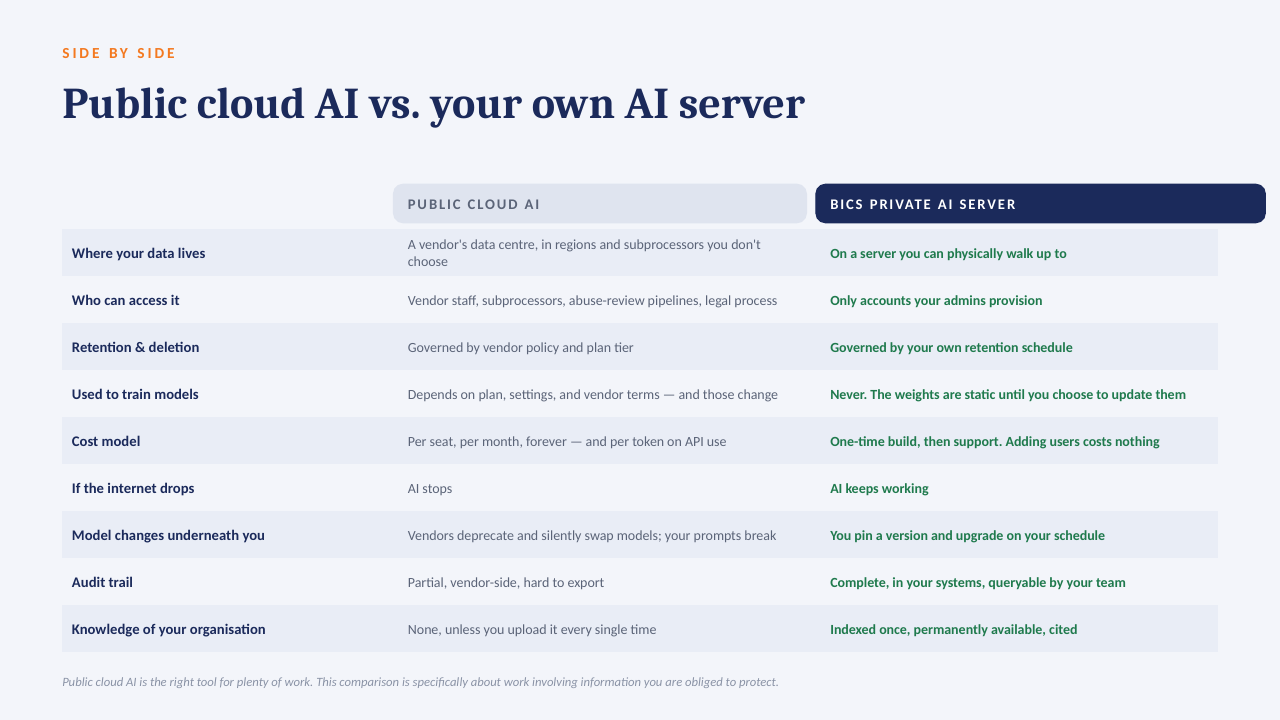
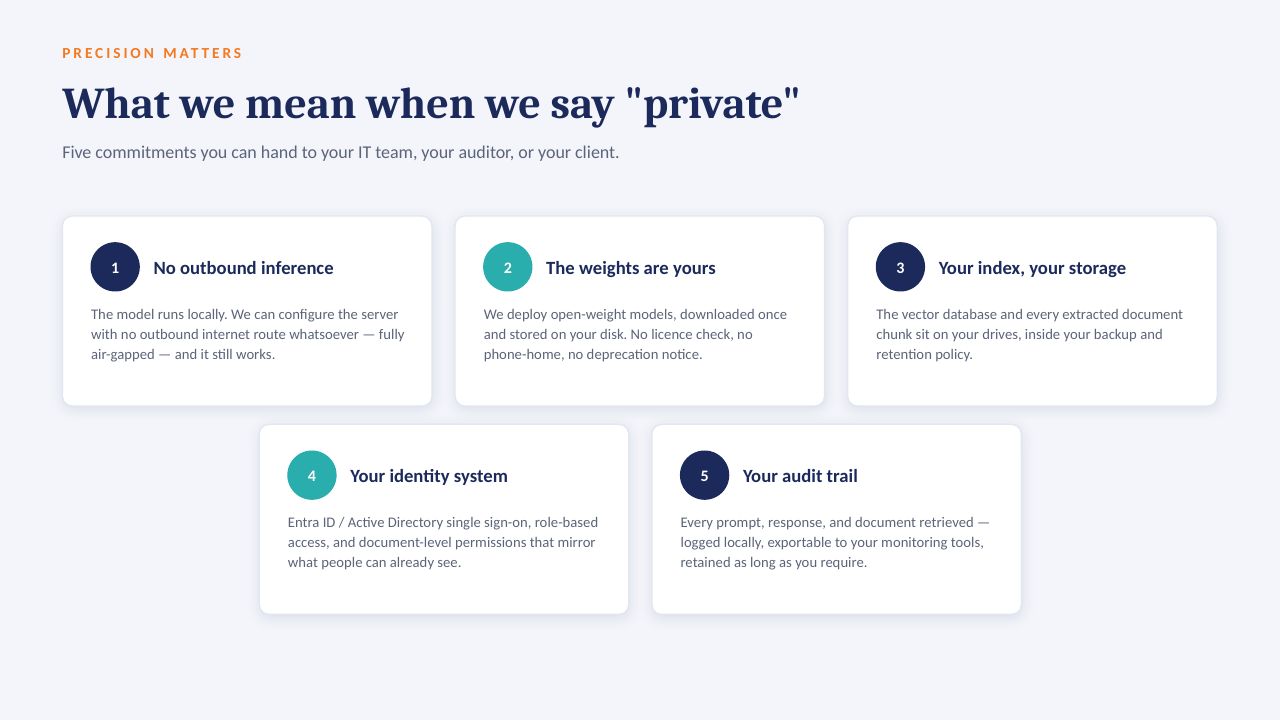
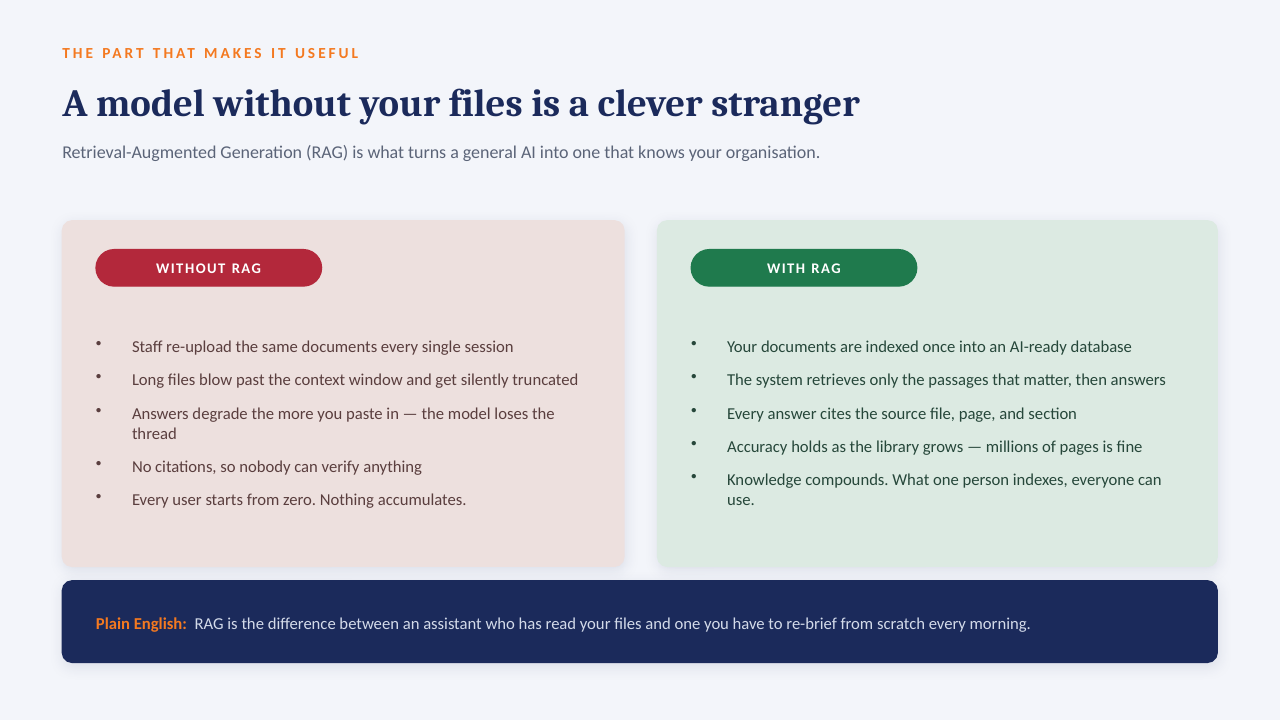
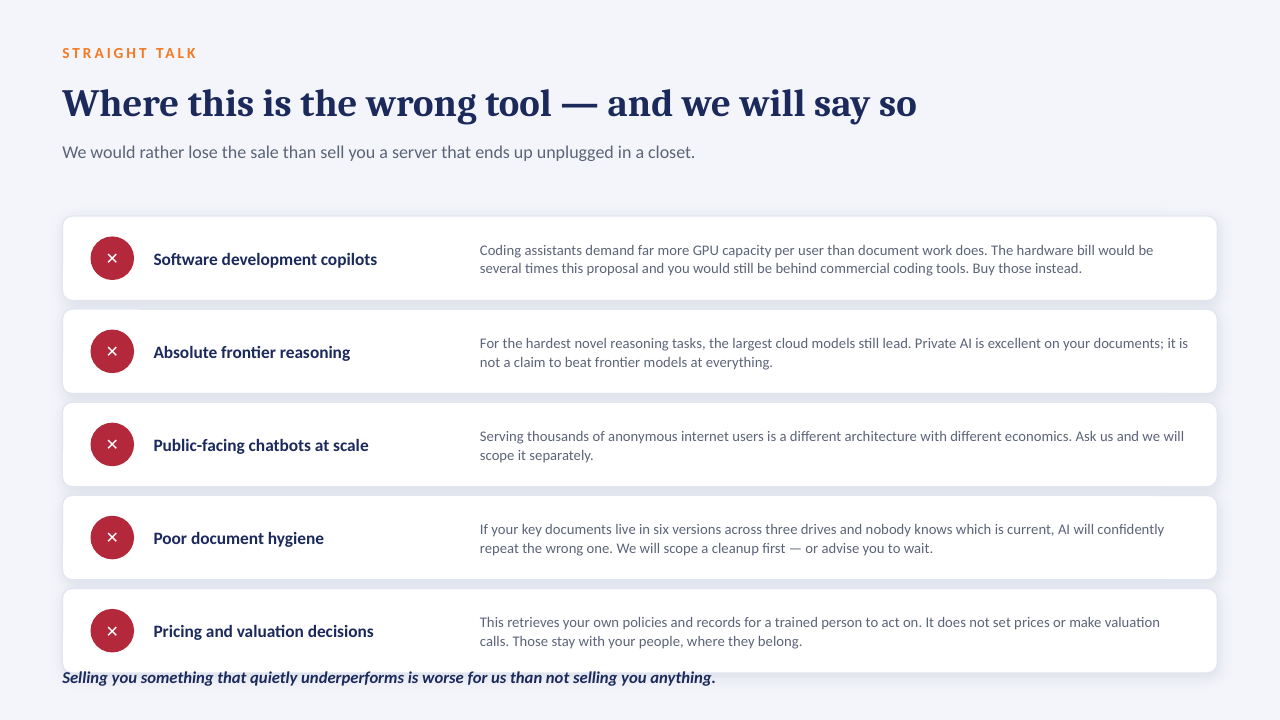
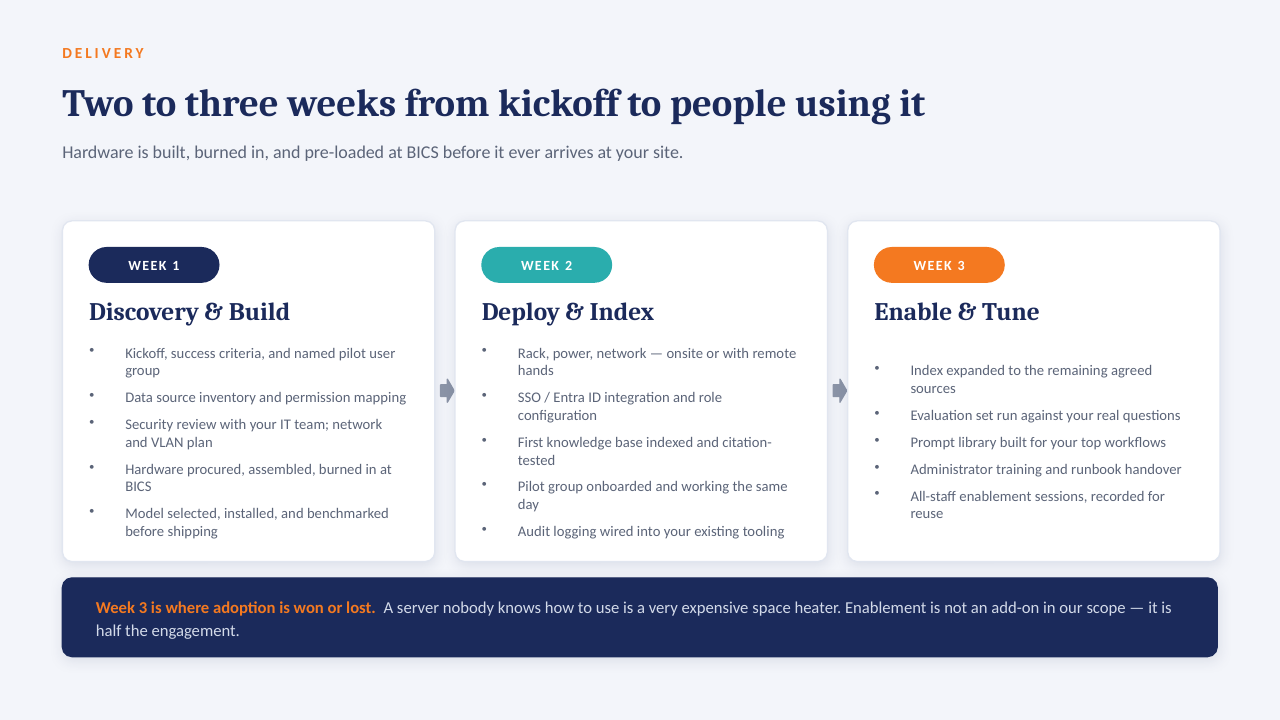
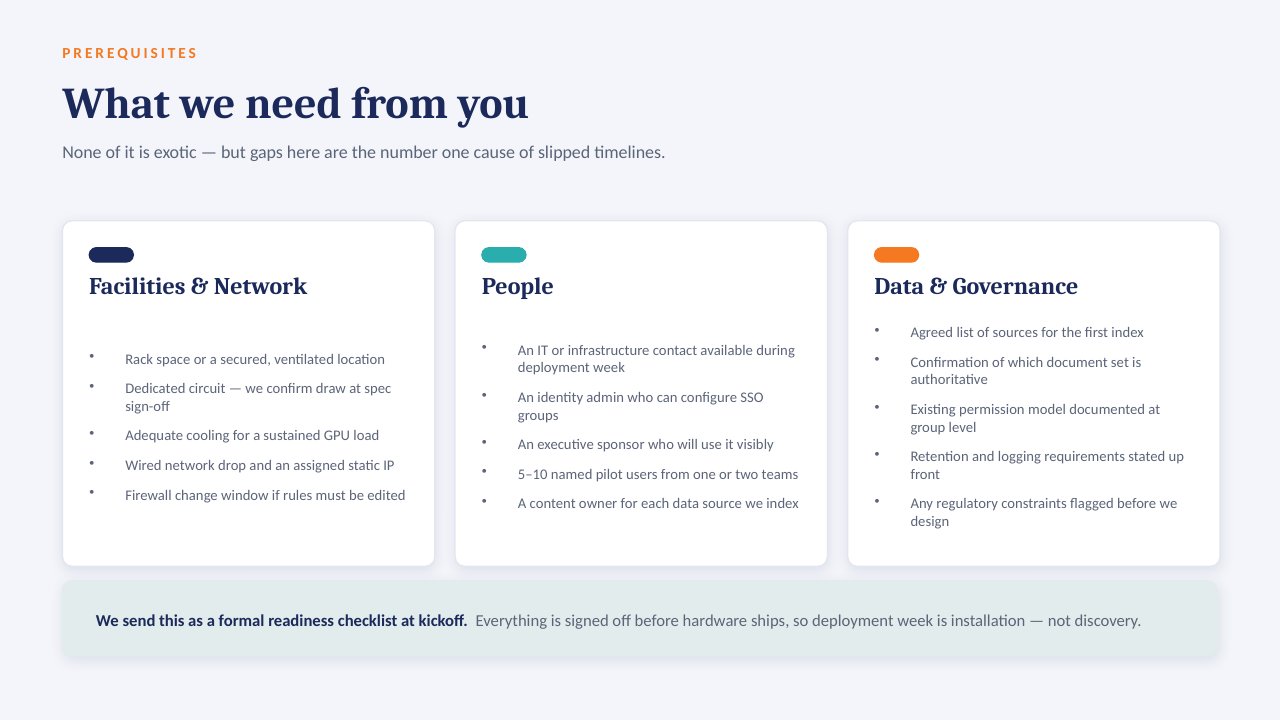
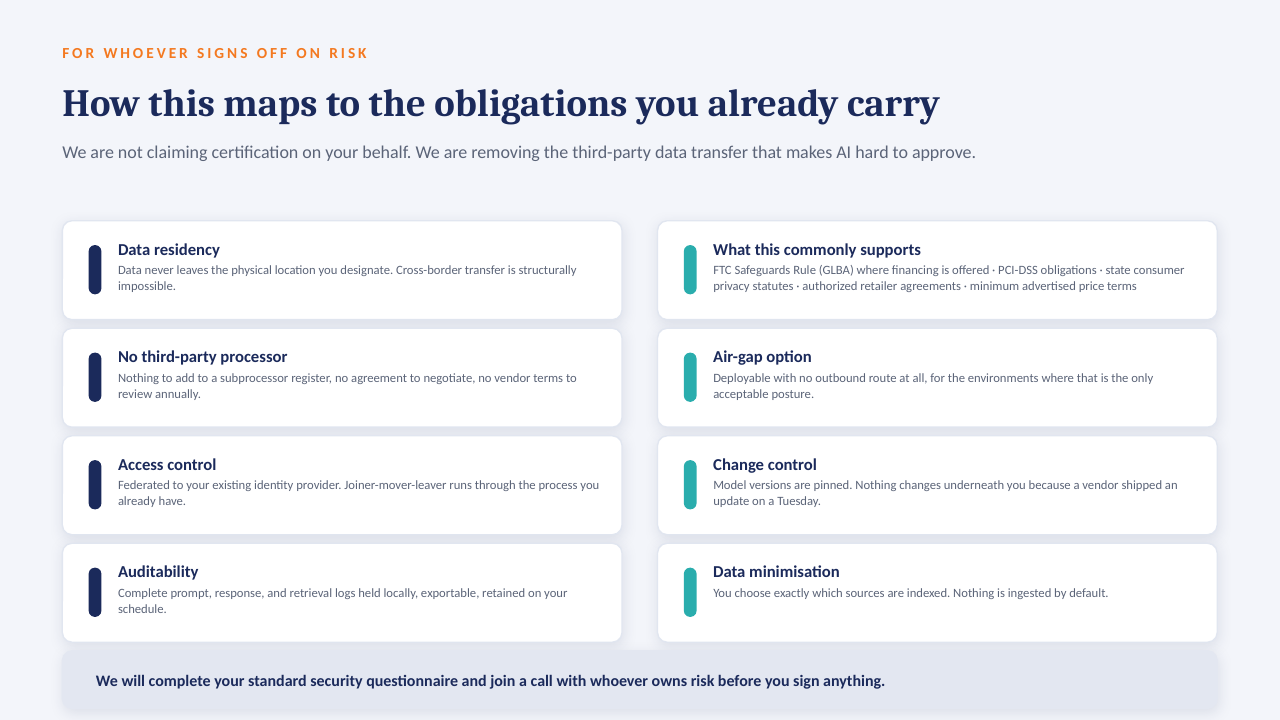
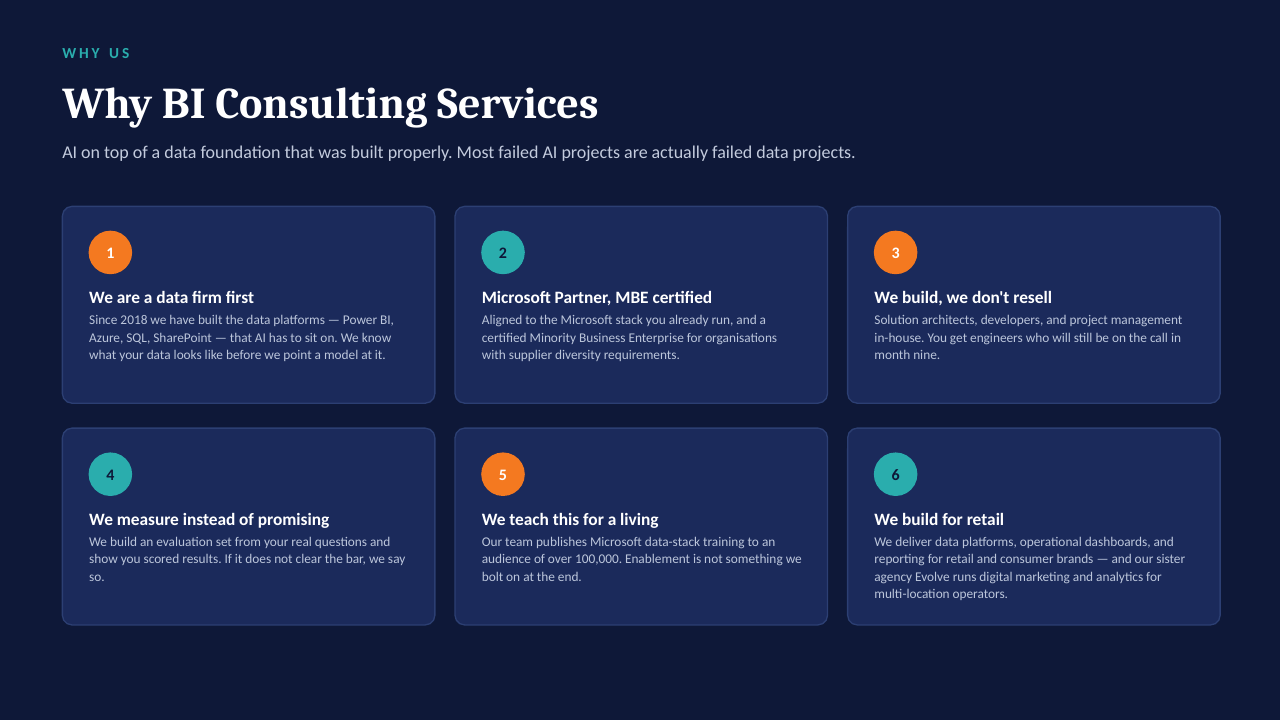
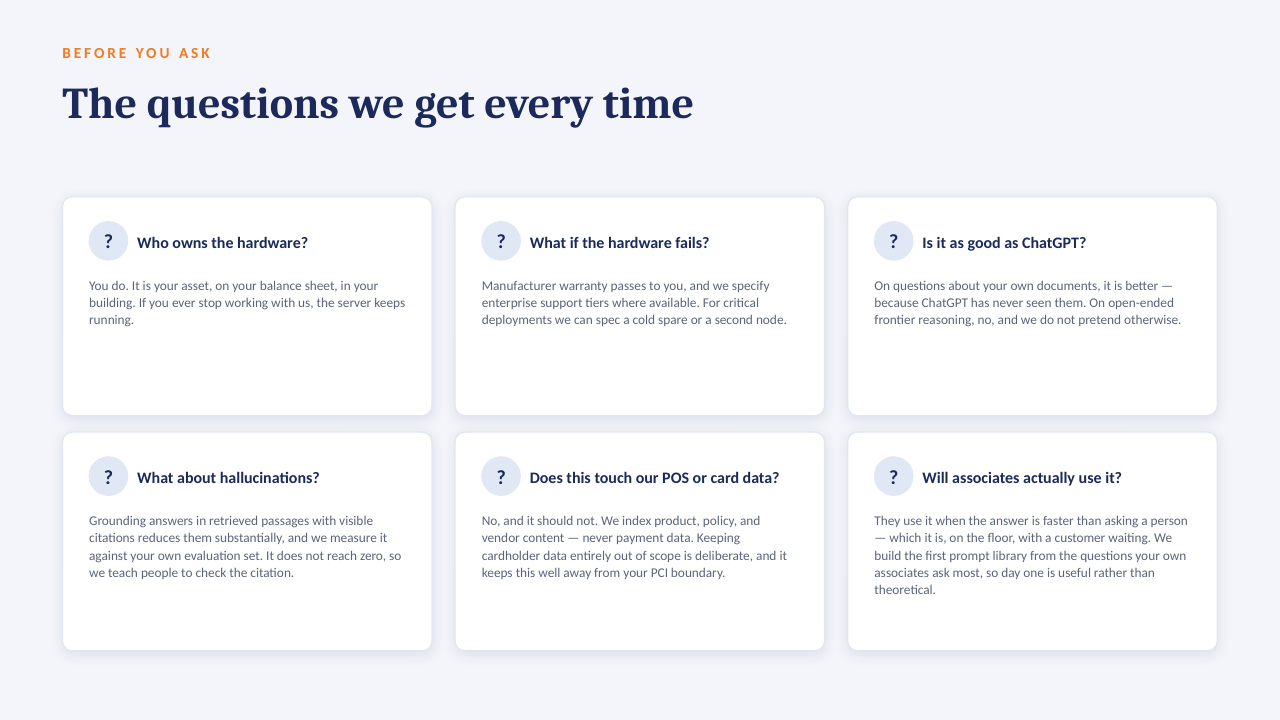
The "ask the data" ideas on this board are designed to run on a GPU server inside your own network — an open-weight model over your own documents, cited answers, no per-seat licence, nothing leaving the building. The short deck below explains how it works. Scroll through, or download it as a PDF.